kbwzy的博客

向未来而生,拥抱人工智能


  • Home

  • Archives

machine learning interview Part1

Posted on 2020-03-23

Maching learning interview Part 1

Bart Anomation

Posted on 2020-01-03

Bart Anomation

下载安装包

step1:进入brat的主页,下载安装包下载安装包brat-v1.3_Crunchy_Frog.tar.gz。链接为:http://brat.nlplab.org/index.html

Step2:解压后,进行安装

1
cd brat-v1.3_Crunchy_Frog

flup python lib

1
cd server/lib && tar xfz flup-1.0.2.tar.gz

如果没有apache,安装:

1
sudo apt-get install apache2

修改apache配置:

1
sudo vim /etc/apache2/apache2.conf

加入如下语句:

1
2
3
4
5
6
7
8
9
10
11
12
<Directory /home/*/public_html>
AllowOverride Options Indexes FileInfo Limit
AddType application/xhtml+xml .xhtml
AddType font/ttf .ttf
# For CGI support
AddHandler cgi-script .cgi
# Comment out the line above and uncomment the line below for FastCGI
#AddHandler fastcgi-script fcgi
</Directory>

# For FastCGI, Single user installs should be fine with anything over 8
#FastCgiConfig -maxProcesses 16

对userdir赋权:

1
2
3
4
5
6
sudo a2enmod userdir

#提示信息为:
# Enabling module userdir.
# To activate the new configuration, you need to run:
# service apache2 restart

继续执行:

1
2
3
4
5
6
sudo apt-get install libapache2-mod-fastcgi
sudo a2enmod fastcgi
sudo a2enmod rewrite
# Enabling module rewrite.
# To activate the new configuration, you need to run:
# service apache2 restart

重新加载apache的配置:

1
sudo /etc/init.d/apache2 reload

这个时候查看http:127.0.0.1便可以看到apache默认页面。

进入到public_html/brat-v1.3_Crunchy_Frog文件夹,然后:

1
2
sudo chgrp -R www-data data work
chmod -R g+rwx data work

安装standalone server

1
bash install.sh -u

然后运行服务:

1
2
python standalone.py
# Serving brat at http://127.0.0.1:8001

出现错误,使用Python2就行

1
python2 standalone.py

配置alise替换命令

1
vim ~/.bashrc

添加如下命令:

1
2
alias cdbrat="cd /usr/local/brat/brat-v1.3_Crunchy_Frog"
alias runbrat="python2 standalone.py"

使其生效:

1
source ~/.bashrc

下次登录直接使用以下命令

1
cdbrat && runbrat

Bert_deploy_for_chinese_classification_task

Posted on 2019-09-30

[转]简单高效的Bert中文文本分类模型开发和部署

1.项目目录路径

  • src/bert是官方源码
  • data是数据,来自项目,文本的3分类问题
  • src/train.sh、classifier.py 训练文件

2019-09-30_091045.png

  • src/export.sh、src/export.py导出TF serving的模型

2019-09-30_091247.png

  • src/client.sh、src/client.py、src/file_base_client.py 处理输入数据并向部署的TF serving的模型发出请求,打印输出结果

    部署指令:

    1
    simple_tensorflow_serving --model_base_path="./api"

    正常启动终端界面:

EvO7HH.png

浏览器访问界面:

EvOouD.png

本地请求代码

分为两种,一种是读取文件的,就是要预测的文本是tsv文件的,叫做file_base_client.py,另一个直接输入文本的是client.py。首先更改input_fn_builder,返回dataset,然后从dataset中取数据,转换为list格式,传入模型,返回结果。

正常情况下的运行结果:

Exkyz4.png

chanese_text_analysis

Posted on 2019-09-21

中文文本分类方法

文本分类 = 文本表示 + 分类模型

文本表示:BOW/N-gram/TF-IDF/word2vec/word embedding/ELMo

词袋模型(中文):

①分词:
第1句话:[w1 w3 w5 w2 w1…]
第2句话:[w11 w32 w51 w21 w15…]
第3句话…
…

  • 载入jieba库,使用jieba.lcut进行分词
1
2
3
4
5
6
7
8
9
10
11
12
13
df = pd.read_csv("./origin_data/entertainment_news.csv", encoding='utf-8')
df = df.dropna()
content=df["content"].values.tolist()
segment=[]
for line in content:
try:
segs=jieba.lcut(line)
for seg in segs:
if len(seg)>1 and seg!='\r\n':
segment.append(seg)
except:
print(line)
continue
  • 去停用词
1
2
3
4
5
words_df=pd.DataFrame({'segment':segment})
#words_df.head()
stopwords=pd.read_csv("origin_data/stopwords.txt",index_col=False,quoting=3,sep="\t",names=['stopword'], encoding='utf-8')#quoting=3全不引用
#stopwords.head()
words_df=words_df[~words_df.segment.isin(stopwords.stopword)]

②统计词频:
w3 count3
w7 count7
wi count_i
…

1
2
3
words_stat=words_df.groupby(by=['segment'])['segment'].agg({"计数":numpy.size})
words_stat=words_stat.reset_index().sort_values(by=["计数"],ascending=False)
words_stat.head()

③构建词典:
选出频次最高的N个词
开[1*n]这样的向量空间
(每个位置是哪个词)

1
2
dictionary = corpora.Dictionary(sentences) #创建字典
corpus = [dictionary.doc2bow(sentence) for sentence in sentences]#创建语料库

④映射:把每句话共构建的词典进行映射
第1句话:[1 0 1 0 1 0…]
第2句话:[0 0 0 0 0 0…1, 0…1,0…]

⑤提升信息的表达充分度:

  • 把是否出现替换成频次

  • 不只记录每个词,我还记录连续的n-gram

    • “李雷喜欢韩梅梅” => (“李雷”,”喜欢”,”韩梅梅”)
    • “韩梅梅喜欢李雷” => (“李雷”,”喜欢”,”韩梅梅”)
    • “李雷喜欢韩梅梅” => (“李雷”,”喜欢”,”韩梅梅”,”李雷喜欢”, “喜欢韩梅梅”)
    • “韩梅梅喜欢李雷” => (“李雷”,”喜欢”,”韩梅梅”,”韩梅梅喜欢”,”喜欢李雷”)
  • 不只是使用频次信息,需要知道词对于句子的重要度

    • TF-IDF = TF(term frequency) + IDF(inverse document frequency)

      ​ import jieba.analyse

      • jieba.analyse.extract_tags(sentence, topK=20, withWeight=False, allowPOS=())

        • sentence 为待提取的文本
        • topK 为返回几个 TF/IDF 权重最大的关键词,默认值为 20
        • withWeight 为是否一并返回关键词权重值,默认值为 False
        • allowPOS 仅包括指定词性的词,默认值为空,即不筛选
1
2
3
4
5
6
7
import jieba.analyse as analyse
import pandas as pd
df = pd.read_csv("./origin_data/technology_news.csv", encoding='utf-8')
df = df.dropna()
lines=df.content.values.tolist()
content = "".join(lines)
print (" ".join(analyse.extract_tags(content, topK=30, withWeight=False, allowPOS=())))

⑥上述的表达都是独立表达(没有词和词在含义空间的分布)
喜欢 = 在乎 = “稀罕” = “中意”

  • word-net (把词汇根据关系构建一张网:近义词、反义词、上位词、下位词…)
    • 怎么更新?
    • 个体差异?
  • 希望能够基于海量数据的分布去学习到一种表示
    • nnlm => 词向量
    • word2vec(周边词类似的这样一些词,是可以互相替换,相同的语境)
      • 捕捉的是相关的词,不是近义词
        • 我 讨厌 你
        • 我 喜欢 你
    • word2vec优化…
    • 用监督学习去调整word2vec的结果(word embedding/词嵌入)
  • 文本预处理
    • 时态语态Normalize
    • 近义词替换
    • stemming
    • …

分类模型:NB/LR/SVM/LSTM(GRU)/CNN

语种判断:拉丁语系,字母组成的,甚至字母也一样 => 字母的使用(次序、频次)不一样

对向量化的输入去做建模
①NB/LR/SVM…建模

  • 可以接受特别高维度的稀疏表示

②MLP/CNN/LSTM

  • 不适合稀疏高维度数据输入 => word2vec

接下来以完成朴素贝叶斯中文分类器项目

数据介绍

选择科技、汽车、娱乐、军事、运动 总共5类文本数据进行处理

1
2
3
4
5
6
7
8
9
10
11
12
13
14
15
16
17
18
19
20
21
22
import jieba
import pandas as pd
df_technology = pd.read_csv("./origin_data/technology_news.csv", encoding='utf-8')
df_technology = df_technology.dropna()

df_car = pd.read_csv("./origin_data/car_news.csv", encoding='utf-8')
df_car = df_car.dropna()

df_entertainment = pd.read_csv("./origin_data/entertainment_news.csv", encoding='utf-8')
df_entertainment = df_entertainment.dropna()

df_military = pd.read_csv("./origin_data/military_news.csv", encoding='utf-8')
df_military = df_military.dropna()

df_sports = pd.read_csv("./origin_data/sports_news.csv", encoding='utf-8')
df_sports = df_sports.dropna()

technology = df_technology.content.values.tolist()[1000:21000]
car = df_car.content.values.tolist()[1000:21000]
entertainment = df_entertainment.content.values.tolist()[:20000]
military = df_military.content.values.tolist()[:20000]
sports = df_sports.content.values.tolist()[:20000]

数据分析与预处理

  • 读取停用词
1
2
stopwords=pd.read_csv("origin_data/stopwords.txt",index_col=False,quoting=3,sep="\t",names=['stopword'], encoding='utf-8')
stopwords=stopwords['stopword'].values
  • 除去停用词

    并且将处理后的数据放到新的文件夹,避免每次重复操作

1
2
3
4
5
6
7
8
9
10
11
12
13
14
15
16
17
18
19
20
21
def preprocess_text(content_lines, sentences, category, target_path):
out_f = open(target_path+"/"+category+".txt", 'w')
for line in content_lines:
try:
segs=jieba.lcut(line)
segs = list(filter(lambda x:len(x)>1, segs)) #没有解析出来的新闻过滤掉
segs = list(filter(lambda x:x not in stopwords, segs)) #把停用词过滤掉
sentences.append((" ".join(segs), category))
out_f.write(" ".join(segs)+"\n")
except Exception as e:
print(line)
continue
out_f.close()

#生成训练数据
sentences = []
preprocess_text(technology, sentences, 'technology', 'processed_data')
preprocess_text(car, sentences, 'car', 'processed_data')
preprocess_text(entertainment, sentences, 'entertainment', 'processed_data')
preprocess_text(military, sentences, 'military', 'processed_data')
preprocess_text(sports, sentences, 'sports', 'processed_data')
  • 生成训练集和验证集

先打乱下,生成更可靠的训练集

1
2
import random
random.shuffle(sentences)

原数据集分词训练集和验证集

1
2
3
from sklearn.model_selection import train_test_split
x, y = zip(*sentences)
x_train, x_test, y_train, y_test = train_test_split(x, y, random_state=1234)

下一步要做的就是在降噪数据上抽取出来有用的特征啦,我们对文本抽取词袋模型特征

1
2
3
4
5
6
7
8
9
10
from sklearn.feature_extraction.text import CountVectorizer

vec = CountVectorizer(
analyzer='word', # tokenise by character ngrams
max_features=4000, # keep the most common 4000 ngrams
)
vec.fit(x_train)

def get_features(x):
vec.transform(x)

把分类器import进来并且训练

1
2
3
from sklearn.naive_bayes import MultinomialNB
classifier = MultinomialNB()
classifier.fit(vec.transform(x_train), y_train)

MultinomialNB(alpha=1.0, class_prior=None, fit_prior=True)

查看准确率

1
classifier.score(vec.transform(x_test), y_test)

.8318188045116215

特征工程

我们可以看到在2w多个样本上,我们能在5个类别上达到83%的准确率。

有没有办法把准确率提高一些呢?

我们可以把特征做得更棒一点,比如说,我们试试加入抽取2-gram和3-gram的统计特征,比如可以把词库的量放大一点。

1
2
3
4
5
6
7
8
9
10
11
from sklearn.feature_extraction.text import CountVectorizer

vec = CountVectorizer(
analyzer='word', # tokenise by character ngrams
ngram_range=(1,4), # use ngrams of size 1, 2, 3, 4
max_features=20000, # keep the most common 2000 ngrams
)
vec.fit(x_train)

def get_features(x):
vec.transform(x)

训练结果提升到0.8732818850175808

建模与优化对比

  • 交叉验证

更可靠的验证效果的方式是交叉验证,但是交叉验证最好保证每一份里面的样本类别也是相对均衡的,我们这里使用StratifiedKFold

1
2
3
4
5
6
7
8
9
10
11
12
13
14
15
16
17
from sklearn.model_selection import StratifiedKFold
from sklearn.metrics import accuracy_score, precision_score
import numpy as np

def stratifiedkfold_cv(x, y, clf_class, shuffle=True, n_folds=5, **kwargs):
stratifiedk_fold = StratifiedKFold(n_splits=n_folds, shuffle=shuffle)
y_pred = y[:]
for train_index, test_index in stratifiedk_fold.split(x, y):
X_train, X_test = x[train_index], x[test_index]
y_train = y[train_index]
clf = clf_class(**kwargs)
clf.fit(X_train,y_train)
y_pred[test_index] = clf.predict(X_test)
return y_pred

NB = MultinomialNB
print(precision_score(y, stratifiedkfold_cv(vec.transform(x),np.array(y),NB), average='macro'))

0.8812996456456414

  • 换模型/特征试试
1
2
3
4
from sklearn.svm import SVC
svm = SVC(kernel='linear')
svm.fit(vec.transform(x_train), y_train)
svm.score(vec.transform(x_test), y_test)
  • rbf核
1
2
3
4
from sklearn.svm import SVC
svm = SVC()
svm.fit(vec.transform(x_train), y_train)
svm.score(vec.transform(x_test), y_test)

项目最终结果

自定义类,以备后续使用

1
2
3
4
5
6
7
8
9
10
11
12
13
14
15
16
17
18
19
20
21
22
23
24
25
26
27
28
29
30
31
import re

from sklearn.feature_extraction.text import CountVectorizer
from sklearn.model_selection import train_test_split
from sklearn.naive_bayes import MultinomialNB


class TextClassifier():

def __init__(self, classifier=MultinomialNB()):
self.classifier = classifier
self.vectorizer = CountVectorizer(analyzer='word', ngram_range=(1,4), max_features=20000)

def features(self, X):
return self.vectorizer.transform(X)

def fit(self, X, y):
self.vectorizer.fit(X)
self.classifier.fit(self.features(X), y)

def predict(self, x):
return self.classifier.predict(self.features([x]))

def score(self, X, y):
return self.classifier.score(self.features(X), y)

def save_model(self, path):
dump((self.classifier, self.vectorizer), path)

def load_model(self, path):
self.classifier, self.vectorizer = load(path)

Proj1_Language_detector

Posted on 2019-09-13

Language_detector base on ML


项目流程与步骤

是一个有监督的文本分类问题。

  1. 读入文件并进行预处理(清洗,分词)

  2. 文本进行向量化表示(TF-IDF,BOW,word2vec,word embedding,ELMo…)

  3. 建模(机器学习,深度学习方法)

  4. 模型封装以备后续使用

  5. 项目部署到Web框架(基于Flask)

数据预处理(清洗,分词)

数据读入并查看数据

twitter数据,包含English, French, German, Spanish, Italian 和 Dutch 6种语言

1
!head -5 data.csv

1 december wereld aids dag voorlichting in zuidafrika over bieten taboes en optimisme,nl
1 millón de afectados ante las inundaciones en sri lanka unicef está distribuyendo ayuda de emergencia srilanka,es
1 millón de fans en facebook antes del 14 de febrero y paty miki dani y berta se tiran en paracaídas qué harías tú porunmillondefans,es
1 satellite galileo sottoposto ai test presso lesaestec nl galileo navigation space in inglese,it
10 der welt sind bei,de

1
2
3
4
5
in_f = open('data.csv')
lines = in_f.readlines()
in_f.close()
dataset = [(line.strip()[:-3], line.strip()[-2:]) for line in lines]
dataset[:5]

[(‘1 december wereld aids dag voorlichting in zuidafrika over bieten taboes en optimisme’,
‘nl’),
(‘1 millón de afectados ante las inundaciones en sri lanka unicef está distribuyendo ayuda de emergencia srilanka’,
‘es’),
(‘1 millón de fans en facebook antes del 14 de febrero y paty miki dani y berta se tiran en paracaídas qué harías tú porunmillondefans’,
‘es’),
(‘1 satellite galileo sottoposto ai test presso lesaestec nl galileo navigation space in inglese’,
‘it’),
(‘10 der welt sind bei’, ‘de’)]

数据集和验证集的拆分

1
2
3
from sklearn.model_selection import train_test_split
x, y = zip(*dataset) #将拆分的数据集进行合拢
x_train, x_test, y_train, y_test = train_test_split(x, y, random_state=1)# random_state是随机种子

数据清洗

用正则表达式对数据进行去噪处理,主要是清楚网址,@,#等内容

1
2
3
4
5
6
7
import re
def remove_noise(document):
noise_pattern = re.compile("|".join(["http\S+", "\@\w+", "\#\w+"]))
clean_text = re.sub(noise_pattern, "", document)
return clean_text.strip()

remove_noise("Trump images are now more popular than cat gifs. @trump #trends http://www.trumptrends.html")

文本进行向量化表示

(TF-IDF,BOW,word2vec,word embedding,ELMo…)

词频向量化和表示

1
2
3
4
5
6
7
8
9
10
11
12
13
14
from sklearn.feature_extraction.text import CountVectorizer

vec = CountVectorizer(
lowercase=True, # 英文文本全小写
analyzer='char_wb', # 逐个字母解析
ngram_range=(1,3), # 1=出现的字母以及每个字母出现的次数,2=出现的连续2个字母,和连续2个字母出现的频次
# trump images are now... => 1gram = t,r,u,m,p... 2gram = tr,ru,um,mp...
max_features=1000, # keep the most common 1000 ngrams
preprocessor=remove_noise
)
vec.fit(x_train)

def get_features(x):
vec.transform(x)

import 分类器

注意这里分类器拟合需要对vector先进行transform处理

1
2
3
from sklearn.naive_bayes import MultinomialNB #多项式分类器
classifier = MultinomialNB()
classifier.fit(vec.transform(x_train), y_train)

3.3 查看分类效果

1
classifier.score(vec.transform(x_test), y_test)

建模(机器学习,深度学习方法)

模型存储

1
2
model_path = "model/language_detector.model"
language_detector.save_model(model_path)

模型加载

1
2
new_language_detector = LanguageDetector()
new_language_detector.load_model(model_path)

使用加载的模型预测

1
new_language_detector.predict("10 der welt sind bei")

模型封装以备后续使用

1
2
3
4
5
6
7
8
9
10
11
12
13
14
15
16
17
18
19
20
21
22
23
24
25
26
27
28
29
30
31
32
33
34
35
36
37
38
39
40
41
42
43
import re
from sklearn.feature_extraction.text import CountVectorizer
from sklearn.model_selection import train_test_split
from sklearn.naive_bayes import MultinomialNB
from joblib import dump, load


class LanguageDetector():
# 成员函数
def __init__(self, classifier=MultinomialNB()):
self.classifier = classifier
self.vectorizer = CountVectorizer(ngram_range=(1,2), max_features=1000, preprocessor=self._remove_noise)

# 私有函数,数据清洗
def _remove_noise(self, document):
noise_pattern = re.compile("|".join(["http\S+", "\@\w+", "\#\w+"]))
clean_text = re.sub(noise_pattern, "", document)
return clean_text

# 特征构建
def features(self, X):
return self.vectorizer.transform(X)

# 拟合数据
def fit(self, X, y):
self.vectorizer.fit(X)
self.classifier.fit(self.features(X), y)

# 预估类别
def predict(self, x):
return self.classifier.predict(self.features([x]))

# 测试集评分
def score(self, X, y):
return self.classifier.score(self.features(X), y)

# 模型持久化存储
def save_model(self, path):
dump((self.classifier, self.vectorizer), path)

# 模型加载
def load_model(self, path):
self.classifier, self.vectorizer = load(path)

项目部署到Web框架(基于Flask)

Flask 工具

部署参考文档

Flask部署机器学习.pdf

NLP-CRF

Posted on 2019-09-07

1.参考blog

NLP-初学条件随机场(CRF)

从隐马尔科夫到条件随机场

ML Learning Note

Posted on 2019-08-31

七月在线机器学习

ML_Interview_Experience

Posted on 2019-08-25

转自:https://ask.julyedu.com/question/88729

基础知识:

常见算法的推导和特点、常见的特征提取方法、处理过拟合的方法、模型评估、模型集成、常见的网络结构、优化方法、梯度消失和爆炸都必须熟悉。这些都是课上讲到过的,只要多温习几遍也就熟悉了。如果有难点确实没理解的,可以拿时间专门攻克,这样可以增强信心。也可以直接请教别人。

项目方面:

重要的是理解算法原理和思想,能够将现实问题转化为机器学习的问题,不是编程经验。

注意知识的系统性和自己的优势

面试的时候,抓住自己熟悉的问题一定要说透,把相关的都说。这样也能把面试官的注意力吸引过来。同时占用了时间,被问到不熟悉领域的机会就少了。
比如问到xgboost,就从决策树(熵)到xgboost都说,同时还要说boost集成的方法,还可以扩展到其他的集成方法(bagging,stacking),还可以对比各种集成的特点,甚至还可以扩展到神经网络,因为神经网络也可以看作是一种集成。
比如问到词向量或嵌入,就从w2v,glove,elmo,到bert都说一遍。如果时间充裕,可以研究各种表示方法,很有意思的。
比如问到关键词提取,就把tf-idf,textrank,lda,都说一遍。如果还知道其他的关键词提取方法就更好。
总之,要让面试官看到你是系统的理解和掌握了,不是零碎的知识。

总结
传统机器学习一定要掌握:svm、lr、决策树、随机森林、GBDT、xgboost和朴素贝叶斯这些基础知识,最好能手推。
深度学习基本都是:CNN以及卷积的意义、RNN以及RNN的初始化、LSTM、常用激活函数(tanh、relu等)这些原理。
自然语言处理方面:一定要把tfidf、word2vec、注意力机制、transformer都熟悉掌握。最好自己去运行几次

ML_Modeling

Posted on 2019-08-25

基于spark的纽约2013出租费用数据分析与建模

项目流程

  1. 数据读取、清洗与关联
  2. 数据探索分析可视化
  3. 数据预处理与特征工程
  4. 建模、超参数调优、预测与模型存储
  5. 模型评估

整个项目会用到很多的spark SQL操作,在大家工业界的实际项目中,除掉spark mllib中默认给到的特征工程模块,我们也会经常用spark SQL来进行特征工程(完成各种统计信息计算与变换)。

数据读取、清洗与关联
1
2
3
4
5
6
7
8
9
10
11
12
13
14
15
16
17
18
19
20
21
22
23
24
25
26
27
28
29
30
31
32
33
34
35
36
37
38
39
40
41
42
43
44
45
46
#数据注册成视图
trip = spark.read.csv(path=trip_file_loc, header=True, inferSchema=True)
fare = spark.read.csv(path=fare_file_loc, header=True, inferSchema=True)
#查看数据字段情况
trip.printSchema()
fare.printSchema()
#使用Spark SQL关联清洗与生成特征数据
sqlStatement = """
SELECT t.medallion,
t.hack_license,
f.total_amount,
f.tolls_amount,
hour(f.pickup_datetime) as pickup_hour,
f.vendor_id,
f.fare_amount,
f.surcharge,
f.tip_amount,
f.payment_type,
t.rate_code,
t.passenger_count,
t.trip_distance,
t.trip_time_in_secs
FROM trip t,
fare f
WHERE t.medallion = f.medallion
AND t.hack_license = f.hack_license
AND t.pickup_datetime = f.pickup_datetime
AND t.passenger_count > 0
and t.passenger_count < 8
AND f.tip_amount >= 0
AND f.tip_amount <= 25
AND f.fare_amount >= 1
AND f.fare_amount <= 250
AND f.tip_amount < f.fare_amount
AND t.trip_distance > 0
AND t.trip_distance <= 100
AND t.trip_time_in_secs >= 30
AND t.trip_time_in_secs <= 7200
AND t.rate_code <= 5
AND f.payment_type in ('CSH','CRD')
"""
trip_fareDF = spark.sql(sqlStatement)

# REGISTER JOINED TRIP-FARE DF IN SQL-CONTEXT
trip_fareDF.createOrReplaceTempView("trip_fare")
#
数据探索分析可视化
1
2
3
4
5
6
7
8
9
10
11
12
13
#使用SQL做数据分析
querySQL = '''
SELECT fare_amount, passenger_count, tip_amount
FROM taxi_train
WHERE passenger_count > 0
AND passenger_count < 7
AND fare_amount > 0
AND fare_amount < 100
AND tip_amount > 0
AND tip_amount < 15
'''
sqlResultsPD = spark.sql(querySQL).toPandas()
#单维度分析与关联分析(利用pyplot绘制图形可视化分析feature的影响和多对多的影响)
数据预处理与特征工程
1
2
3
4
5
6
7
8
9
10
11
#数据变换与特征工程(类别性可以进行数值序号编码转换OneHotEncoder)
#切分为训练集和数据集(randomSplit)
trainingFraction = 0.75; testingFraction = (1-trainingFraction);
seed = 1234;

# SPLIT SAMPLED DATA-FRAME INTO TRAIN/TEST, WITH A RANDOM COLUMN ADDED FOR DOING CV (SHOWN LATER)
trainData, testData = encodedFinal.randomSplit([trainingFraction, testingFraction], seed=seed);

# CACHE DATA FRAMES IN MEMORY
trainData.persist(); trainData.count()
testData.persist(); testData.count()
建模、超参数调优、预测与模型存储
1
2
3
4
5
6
7
8
9
10
11
12
13
14
15
16
17
18
19
20
21
22
23
24
25
26
27
28
29
30
31
32
33
34
35
36
37
38
39
40
41
42
43
44
45
46
47
48
49
50
51
52
53
54
55
56
57
58
59
60
61
62
#GBT Regression
from pyspark.ml.regression import GBTRegressor

## DEFINE REGRESSION FURMULA
regFormula = RFormula(formula="tip_amount ~ paymentIndex + vendorIndex + rateIndex + TrafficTimeBinsIndex + pickup_hour + passenger_count + trip_time_in_secs + trip_distance + fare_amount")

## DEFINE INDEXER FOR CATEGORIAL VARIABLES
featureIndexer = VectorIndexer(inputCol="features", outputCol="indexedFeatures", maxCategories=32)

## DEFINE GRADIENT BOOSTING TREE REGRESSOR
gBT = GBTRegressor(featuresCol="indexedFeatures", maxIter=10)

## Fit model, with formula and other transformations
model = Pipeline(stages=[regFormula, featureIndexer, gBT]).fit(trainData)

## PREDICT ON TEST DATA AND EVALUATE
predictions = model.transform(testData)
predictionAndLabels = predictions.select("label","prediction").rdd
testMetrics = RegressionMetrics(predictionAndLabels)
print("RMSE = %s" % testMetrics.rootMeanSquaredError)
print("R-sqr = %s" % testMetrics.r2)

## PLOC ACTUALS VS. PREDICTIONS
predictions.select("label","prediction").createOrReplaceTempView("tmp_results");

#超参数调优
from pyspark.ml.tuning import CrossValidator, ParamGridBuilder
from pyspark.ml.evaluation import RegressionEvaluator

## DEFINE RANDOM FOREST MODELS
randForest = RandomForestRegressor(featuresCol = 'indexedFeatures', labelCol = 'label',
featureSubsetStrategy="auto",impurity='variance', maxBins=100)

## DEFINE MODELING PIPELINE, INCLUDING FORMULA, FEATURE TRANSFORMATIONS, AND ESTIMATOR
pipeline = Pipeline(stages=[regFormula, featureIndexer, randForest])

## DEFINE PARAMETER GRID FOR RANDOM FOREST
paramGrid = ParamGridBuilder() \
.addGrid(randForest.numTrees, [10, 25, 50]) \
.addGrid(randForest.maxDepth, [3, 5, 7]) \
.build()

## DEFINE CROSS VALIDATION
crossval = CrossValidator(estimator=pipeline,
estimatorParamMaps=paramGrid,
evaluator=RegressionEvaluator(metricName="rmse"),
numFolds=3)

## TRAIN MODEL USING CV
cvModel = crossval.fit(trainData)

## PREDICT AND EVALUATE TEST DATA SET
predictions = cvModel.transform(testData)
evaluator = RegressionEvaluator(labelCol="label", predictionCol="prediction", metricName="r2")
r2 = evaluator.evaluate(predictions)
print("R-squared on test data = %g" % r2)

## SAVE THE BEST MODEL
datestamp = datetime.datetime.now().strftime('%m-%d-%Y-%s');
fileName = "CV_RandomForestRegressionModel_" + datestamp;
CVDirfilename = modelDir + fileName;
cvModel.bestModel.save(CVDirfilename);
模型评估以及保存加载
1
2
3
4
5
6
7
8
9
10
11
12
13
14
#from pyspark.ml import PipelineModel

savedModel = PipelineModel.load(randForestDirfilename)

predictions = savedModel.transform(testData)
predictionAndLabels = predictions.select("label","prediction").rdd
testMetrics = RegressionMetrics(predictionAndLabels)
print("RMSE = %s" % testMetrics.rootMeanSquaredError)
print("R-sqr = %s" % testMetrics.r2)
#结果存储到HDFS
datestamp = datetime.datetime.now().strftime('%m-%d-%Y-%s');
fileName = "Predictions_CV_" + datestamp;
predictionfile = dataDir + fileName;
predictions.select("label","prediction").write.mode("overwrite").csv(predictionfile)

基于spark的航班延误数据分析与建模

数据读取、清洗与关联
1
2
3
4
5
6
7
8
9
10
11
12
13
14
15
16
17
18
19
20
21
22
23
24
25
26
27
28
29
30
31
32
33
34
35
36
37
38
39
40
41
42
43
44
45
46
47
48
49
50
51
52
53
54
55
56
57
58
59
60
61
62
63
64
65
66
67
68
69
70
71
72
73
74
75
76
77
78
79
#数据注册成视图
# COUNT FLIGHTS BY AIRPORT
spark.sql("SELECT ORIGIN, COUNT(*) as CTORIGIN FROM airline GROUP BY ORIGIN").createOrReplaceTempView("countOrigin")
spark.sql("SELECT DEST, COUNT(*) as CTDEST FROM airline GROUP BY DEST").createOrReplaceTempView("countDest")

## CLEAN AIRLINE DATA WITH QUERY, FILTER FOR AIRPORTS WHICH HAVE VERY FEW FLIGHTS (<100)
sqlStatement = """
SELECT ARR_DEL15 as ArrDel15,
YEAR as Year,
MONTH as Month,
DAY_OF_MONTH as DayOfMonth,
DAY_OF_WEEK as DayOfWeek,
UNIQUE_CARRIER as Carrier,
ORIGIN_AIRPORT_ID as OriginAirportID,
ORIGIN,
DEST_AIRPORT_ID as DestAirportID,
DEST,
floor(CRS_DEP_TIME/100) as CRSDepTime,
floor(CRS_ARR_TIME/100) as CRSArrTime
FROM airline
WHERE ARR_DEL15 in ('0.0', '1.0')
AND ORIGIN IN (
SELECT DISTINCT ORIGIN
FROM countOrigin
where CTORIGIN > 100
)
AND DEST IN (
SELECT DISTINCT DEST
FROM countDest
where CTDEST > 100
)
"""
airCleaned = spark.sql(sqlStatement)

# REGISTER CLEANED AIR DATASET
airCleaned.createOrReplaceTempView("airCleaned")

## CLEAN WEATHER DATA WITH QUERY
sqlStatement = """
SELECT AdjustedYear,
AdjustedMonth,
AdjustedDay,
AdjustedHour,
AirportID,
avg(Visibility) as Visibility,
avg(DryBulbCelsius) as DryBulbCelsius,
avg(DewPointCelsius) as DewPointCelsius,
avg(RelativeHumidity) as RelativeHumidity,
avg(WindSpeed) as WindSpeed,
avg(Altimeter) as Altimeter
FROM weather
GROUP BY AdjustedYear,
AdjustedMonth,
AdjustedDay,
AdjustedHour,
AirportID
"""
weatherCleaned = spark.sql(sqlStatement)

# REGISTER CLEANED AIR DATASET
weatherCleaned.createOrReplaceTempView("weatherCleaned")
#按照年做数据切分,2011年的数据做训练,2012年的数据做验证
sqlStatement = """SELECT * from joined WHERE Year = 2011"""
train = spark.sql(sqlStatement)

# REGISTER JOINED
sqlStatement = """SELECT * from joined WHERE Year = 2012"""
validation = spark.sql(sqlStatement)
#数据存储
# SAVE JOINED DATA IN BLOB
trainfilename = dataDir + "TrainData";
train.write.mode("overwrite").parquet(trainfilename)

validfilename = dataDir + "ValidationData";
validation.write.mode("overwrite").parquet(validfilename)
#处理好的数据进行缓存
## PERSIST AND MATERIALIZE DF IN MEMORY
train_df.persist()
train_df.count()
数据探索分析可视化
1
2
3
4
5
6
7
8
9
10
11
12
13
14
15
16
17
18
#单维度和多维度分析
%%local
%matplotlib inline
import matplotlib.pyplot as plt
## %%local creates a pandas data-frame on the head node memory, from spark data-frame,
## which can then be used for plotting. Here, sampling data is a good idea, depending on the memory of the head node

# TIP BY PAYMENT TYPE AND PASSENGER COUNT
ax1 = sqlResultsPD[['WindSpeedDest']].plot(kind='hist', bins=25, facecolor='lightblue')
ax1.set_title('WindSpeed @ Destination distribution')
ax1.set_xlabel('WindSpeedDest'); ax1.set_ylabel('Counts');
plt.figure(figsize=(4,4)); plt.suptitle(''); plt.show()

# TIP BY PASSENGER COUNT
ax2 = sqlResultsPD.boxplot(column=['WindSpeedDest'], by=['ArrDel15'])
ax2.set_title('WindSpeed Destination')
ax2.set_xlabel('ArrDel15'); ax2.set_ylabel('WindSpeed');
plt.figure(figsize=(4,4)); plt.suptitle(''); plt.show()
数据预处理与特征工程
1
2
3
4
5
6
7
8
9
10
11
12
13
14
15
16
17
18
19
20
21
22
23
24
25
26
27
28
29
30
31
32
33
34
35
36
37
38
39
40
41
42
43
44
45
46
#过滤非空值
## EXAMPLES BELOW ALSO SHOW HOW TO USE SQL DIRECTLY ON DATAFRAMES
trainPartitionFilt = trainPartition.filter("ArrDel15 is not NULL and DayOfMonth is not NULL and DayOfWeek is not NULL \
and Carrier is not NULL and OriginAirportID is not NULL and DestAirportID is not NULL \
and CRSDepTime is not NULL and VisibilityOrigin is not NULL and DryBulbCelsiusOrigin is not NULL \
and DewPointCelsiusOrigin is not NULL and RelativeHumidityOrigin is not NULL \
and WindSpeedOrigin is not NULL and AltimeterOrigin is not NULL \
and VisibilityDest is not NULL and DryBulbCelsiusDest is not NULL \
and DewPointCelsiusDest is not NULL and RelativeHumidityDest is not NULL \
and WindSpeedDest is not NULL and AltimeterDest is not NULL ")
trainPartitionFilt.persist(); trainPartitionFilt.count()
trainPartitionFilt.createOrReplaceTempView("TrainPartitionFilt")
#测试集非空值也要过滤,保证测试机中的类型能覆盖训练集
testPartitionFilt = testPartition.filter("ArrDel15 is not NULL and DayOfMonth is not NULL and DayOfWeek is not NULL \
and Carrier is not NULL and OriginAirportID is not NULL and DestAirportID is not NULL \
and CRSDepTime is not NULL and VisibilityOrigin is not NULL and DryBulbCelsiusOrigin is not NULL \
and DewPointCelsiusOrigin is not NULL and RelativeHumidityOrigin is not NULL \
and WindSpeedOrigin is not NULL and AltimeterOrigin is not NULL \
and VisibilityDest is not NULL and DryBulbCelsiusDest is not NULL \
and DewPointCelsiusDest is not NULL and RelativeHumidityDest is not NULL \
and WindSpeedDest is not NULL and AltimeterDest is not NULL") \
.filter("OriginAirportID IN (SELECT distinct OriginAirportID FROM TrainPartitionFilt) \
AND ORIGIN IN (SELECT distinct ORIGIN FROM TrainPartitionFilt) \
AND DestAirportID IN (SELECT distinct DestAirportID FROM TrainPartitionFilt) \
AND DEST IN (SELECT distinct DEST FROM TrainPartitionFilt) \
AND Carrier IN (SELECT distinct Carrier FROM TrainPartitionFilt) \
AND CRSDepTime IN (SELECT distinct CRSDepTime FROM TrainPartitionFilt) \
AND DayOfMonth in (SELECT distinct DayOfMonth FROM TrainPartitionFilt) \
AND DayOfWeek in (SELECT distinct DayOfWeek FROM TrainPartitionFilt)")
testPartitionFilt.persist(); testPartitionFilt.count()
testPartitionFilt.createOrReplaceTempView("TestPartitionFilt")
#建pipeline
# TRANSFORM SOME FEATURES BASED ON MLLIB TRANSFORMATION FUNCTIONS
from pyspark.ml import Pipeline
from pyspark.ml.feature import StringIndexer, VectorIndexer, Bucketizer, Binarizer

sI0 = StringIndexer(inputCol = 'ArrDel15', outputCol = 'ArrDel15_ind');
bin0 = Binarizer(inputCol = 'ArrDel15_ind', outputCol = 'ArrDel15_bin', threshold = 0.5);
sI1 = StringIndexer(inputCol="Carrier", outputCol="Carrier_ind");
transformPipeline = Pipeline(stages=[sI0, bin0, sI1]);

transformedTrain = transformPipeline.fit(trainPartition).transform(trainPartitionFilt)
transformedTest = transformPipeline.fit(trainPartition).transform(testPartitionFilt)

transformedTrain.persist(); transformedTrain.count();
transformedTest.persist(); transformedTest.count();
建模、超参数调优、预测与模型存储
1
2
3
4
5
6
7
8
9
10
11
12
13
14
15
16
17
18
19
20
21
22
23
24
25
26
27
28
29
30
31
32
33
34
35
36
37
38
39
40
41
42
43
44
45
46
47
48
49
50
51
52
53
54
55
56
57
58
59
60
61
62
63
64
65
66
67
68
69
70
71
72
73
74
75
76
77
78
79
80
81
82
83
84
85
86
87
88
89
90
#RL建模并使用ROC进行评估
from pyspark.ml.classification import LogisticRegression
from pyspark.mllib.evaluation import BinaryClassificationMetrics
from sklearn.metrics import roc_curve,auc

## DEFINE ELASTIC NET REGRESSOR
eNet = LogisticRegression(featuresCol="indexedFeatures", maxIter=25, regParam=0.01, elasticNetParam=0.5)

## TRAINING PIPELINE: Fit model, with formula and other transformations
model = Pipeline(stages=[regFormula, featureIndexer, eNet]).fit(transformedTrain)

# SAVE MODEL
datestamp = datetime.datetime.now().strftime('%m-%d-%Y-%s');
fileName = "logisticRegModel_" + datestamp;
logRegDirfilename = modelDir + fileName;
model.save(logRegDirfilename)

## Evaluate model on test set
predictions = model.transform(transformedTest)
predictionAndLabels = predictions.select("label","prediction").rdd
predictions.select("label","probability").createOrReplaceTempView("tmp_results")

metrics = BinaryClassificationMetrics(predictionAndLabels)
print("Area under ROC = %s" % metrics.areaUnderROC)
#ROC曲线绘制模板
%%local
## PLOT ROC CURVE AFTER CONVERTING PREDICTIONS TO A PANDAS DATA FRAME
from sklearn.metrics import roc_curve,auc
import matplotlib.pyplot as plt
%matplotlib inline

labels = predictions_pddf["label"]
prob = []
for dv in predictions_pddf["probability"]:
prob.append(list(dv.values())[1][1])

fpr, tpr, thresholds = roc_curve(labels, prob, pos_label=1);
roc_auc = auc(fpr, tpr)

plt.figure(figsize=(5,5))
plt.plot(fpr, tpr, label='ROC curve (area = %0.2f)' % roc_auc)
plt.plot([0, 1], [0, 1], 'k--')
plt.xlim([0.0, 1.0]); plt.ylim([0.0, 1.05]);
plt.xlabel('False Positive Rate'); plt.ylabel('True Positive Rate');
plt.title('ROC Curve'); plt.legend(loc="lower right");
plt.show()
################################################
## DEFINE GRADIENT BOOSTING TREE CLASSIFIER
gBT = GBTRegressor(featuresCol="indexedFeatures", maxIter=10, maxBins = 250)
## DEFINE RANDOM FOREST CLASSIFIER
randForest = RandomForestClassifier(featuresCol = 'indexedFeatures', labelCol = 'label', numTrees=20, maxDepth=6, maxBins=250)
#网格搜索交叉验证做超参数调优
from pyspark.ml.tuning import CrossValidator, ParamGridBuilder
from pyspark.ml.evaluation import BinaryClassificationEvaluator

## DEFINE RANDOM FOREST MODELS
## DEFINE RANDOM FOREST CLASSIFIER
randForest = RandomForestClassifier(featuresCol = 'indexedFeatures', labelCol = 'label', numTrees=20, \
maxDepth=6, maxBins=250)


## DEFINE MODELING PIPELINE, INCLUDING FORMULA, FEATURE TRANSFORMATIONS, AND ESTIMATOR
pipeline = Pipeline(stages=[regFormula, featureIndexer, randForest])

## DEFINE PARAMETER GRID FOR RANDOM FOREST
paramGrid = ParamGridBuilder() \
.addGrid(randForest.numTrees, [10, 25, 50]) \
.addGrid(randForest.maxDepth, [3, 5, 7]) \
.build()

## DEFINE CROSS VALIDATION
crossval = CrossValidator(estimator=pipeline,
estimatorParamMaps=paramGrid,
evaluator=BinaryClassificationEvaluator(metricName="areaUnderROC"),
numFolds=3)

## TRAIN MODEL USING CV
cvModel = crossval.fit(transformedTrain)

## Evaluate model on test set
predictions = cvModel.transform(transformedTest)
predictionAndLabels = predictions.select("label","prediction").rdd
metrics = BinaryClassificationMetrics(predictionAndLabels)
print("Area under ROC = %s" % metrics.areaUnderROC)

## SAVE THE BEST MODEL
datestamp = datetime.datetime.now().strftime('%m-%d-%Y-%s');
fileName = "CV_RandomForestRegressionModel_" + datestamp;
CVDirfilename = modelDir + fileName;
cvModel.bestModel.save(CVDirfilename);
模型评估以及保存加载
1
2
3
4
5
6
7
8
9
from pyspark.ml import PipelineModel

savedModel = PipelineModel.load(logRegDirfilename)

## Evaluate model on test set
predictions = savedModel.transform(transformedTest)
predictionAndLabels = predictions.select("label","prediction").rdd
metrics = BinaryClassificationMetrics(predictionAndLabels)
print("Area under ROC = %s" % metrics.areaUnderROC)

###

ML_Interview_100_times

Posted on 2019-08-11

第一章 特征工程

  1. ​ 对于一个机器学习问题,数据和特征往往觉得了结果的上限,而模型算、算法的选择及优化则是逐步逼近这个上限,课件特征工程的重要性。

    特征工程,对一组原始数据进行一系列工程处理,将其提炼为特征,作为输入供算法和模型使用。

    两种数据结构

  1. 两种常见的数据结构

    • 结构化数据
      • 看作关系型数据库的一张表,每一列都有清晰的定义,包含数值型、类别性两种基本类型。
    • 非结构化数据
      • 包括文本、图形、音频、视频,包含的信息无法用一个简单的数值表示,也没有清晰的定义,每一条的大小各不相同。

    01 特征归一化

    为了消除数据特征之间的量纲影响,我们需要对特征进行归一化处理。使得不同的指标之间具有可比性。

    (1) 线性函数归一化($Min-Max Scaling$)。

    归一化公式为:

    1

    (2) 零均值归一化($Z-Score Normalization$)。将原始数据映射到均值为0,标准差为1的分布。
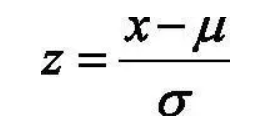
    2

12

kbwzy

一个汽车工程师的转型之路

12 posts
7 tags
© 2020 kbwzy
Powered by Hexo
|
Theme — NexT.Muse v5.1.4